

Q3 2026 Property Management Market Report
San Jose & Silicon Valley Rental Market | July–September 2026
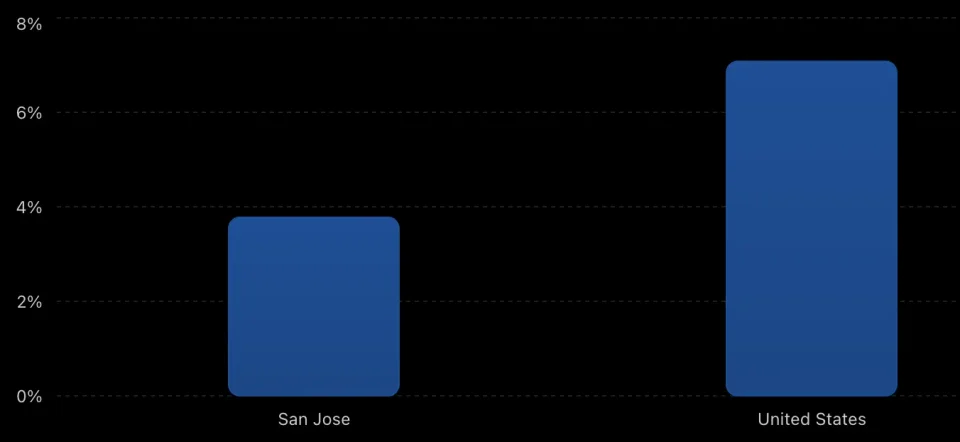
Market snapshot: San Jose rents are up 6.5% year over year, while the city’s August vacancy rate was 3.78%, compared with 7.08% nationally.
1. Rent Snapshot
Median monthly rent — September 2026
Overall median rent compared with selected Silicon Valley markets.
| Market | Rent |
|---|---|
| San Jose | 3132 |
| Santa Clara | 3536 |
| Mountain View | 3537 |
| Sunnyvale | 3724 |
Source: Apartment List, September 2026.
San Jose: $3,132 median rent
1 bedroom: $2,725
2 bedroom: $3,234
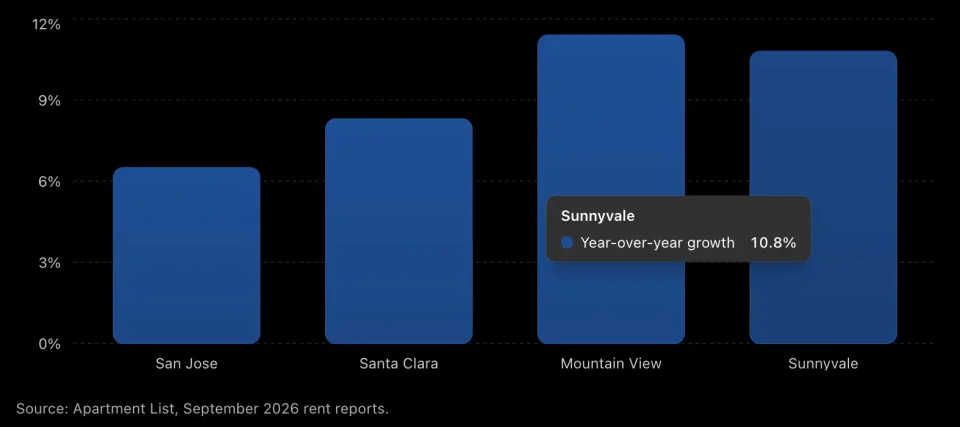
2. Year-over-Year Rent Growth
Annual rent growth — 2026
Year-over-year median rent change in selected Silicon Valley markets.
Source: Apartment List, September 2026 rent reports.
San Jose: +6.5%
Santa Clara: +8.3%
Mountain View: +11.4%
Sunnyvale: +10.8%
3. Vacancy & Leasing Speed
Vacancy rate — August 2026
San Jose compared with the U.S. rental market.
Source: Apartment List Vacancy Index, August 2026.
| Metric | San Jose | U.S. |
|---|---|---|
| Vacancy | 3.78% | 7.08% |
| Time on market | 23.0 days | 31.7 days |
| Median rent | $3,347* | $1,390* |
*August metro/market figures; September city rent data differs by methodology and geography.
4. What This Means for Landlords
Q3 numbers
| Indicator | Q3 2026 |
|---|---|
| San Jose median rent | $3,132 |
| 1-bedroom | $2,725 |
| 2-bedroom | $3,234 |
| Annual rent growth | +6.5% |
| Vacancy | 3.78% |
| Typical time on market | 23 days |
| National vacancy | 7.08% |
Landlord focus: pricing • vacancy • maintenance • tenant retention • compliance • operating costs
5. Rent-Increase Reference
For California properties covered by the statewide Tenant Protection Act, the maximum increase for increases beginning August 1, 2026–July 31, 2027 is:
California rent-increase limits
Selected limits applicable to covered properties for the stated periods.
Source: California Department of Justice. Local exemptions and ordinances may apply.
Important: These are not universal rent-increase permissions. Property eligibility and local ordinances must be checked first. California’s statewide cap is generally 5% + cost of living, up to 10%, while local rules can impose lower limits.
Q3 2026 Property Management Market Report
Q3 2026 PROPERTY MANAGEMENT MARKET REPORT
SAN JOSE & SILICON VALLEY
JULY — SEPTEMBER 2026
MARKET AT A GLANCE
$3,132
San Jose Median Rent
+6.5%
Year-over-Year Rent Growth
3.78%
San Jose Vacancy Rate
23 DAYS
Typical Time on Market
RENT BY PROPERTY SIZE
| Property | Median Monthly Rent |
|---|---|
| 1 Bedroom | $2,725 |
| 2 Bedroom | $3,234 |
| Overall | $3,132 |
SILICON VALLEY RENT GROWTH
| Market | YoY Change |
|---|---|
| San Jose | +6.5% |
| Santa Clara | +8.3% |
| Sunnyvale | +10.8% |
| Mountain View | +11.4% |
VACANCY
SAN JOSE
3.78%
U.S.
7.08%
Difference
3.30 percentage points
LEASING SPEED
San Jose: 23 days
U.S.: 31.7 days
8.7 DAYS FASTER
LANDLORD Q3 SCORECARD
| Category | Q3 Indicator |
|---|---|
| Rental demand | 3.78% vacancy |
| Rent growth | +6.5% YoY |
| Leasing speed | 23 days |
| 1-bedroom rent | $2,725 |
| 2-bedroom rent | $3,234 |
| Market review | Recommended |
| Maintenance review | Recommended |
| Lease review | Recommended |
Q4 LANDLORD CHECKLIST
REVIEW
☐ Current market rent
☐ Lease expiration dates
☐ Vacancy
☐ Maintenance expenses
☐ Property condition
☐ Tenant retention
☐ Insurance costs
☐ Vendor costs
☐ Applicable rent regulations
☐ 2027 operating budget
Q3 MARKET TAKEAWAY
RENT ↑
VACANCY ↓
LEASING SPEED ↑
For San Jose landlords, Q3 data shows a rental market with 6.5% year-over-year rent growth and 3.78% vacancy in August 2026. Individual properties can perform differently, so owners should evaluate their property’s rent, condition, expenses, and leasing activity against current comparable properties.
Data sources: Apartment List; California Department of Justice. Market statistics represent the periods specified above and may use different geographic definitions and methodologies.
Leave a Reply